 CNV Connect
Numbers that come from the same records
Attendance, headcount, contracts and assets — computed live from what your teams filed, not typed into a second spreadsheet.
One catalogue
Every report in one place, filtered by the permissions of whoever is looking.
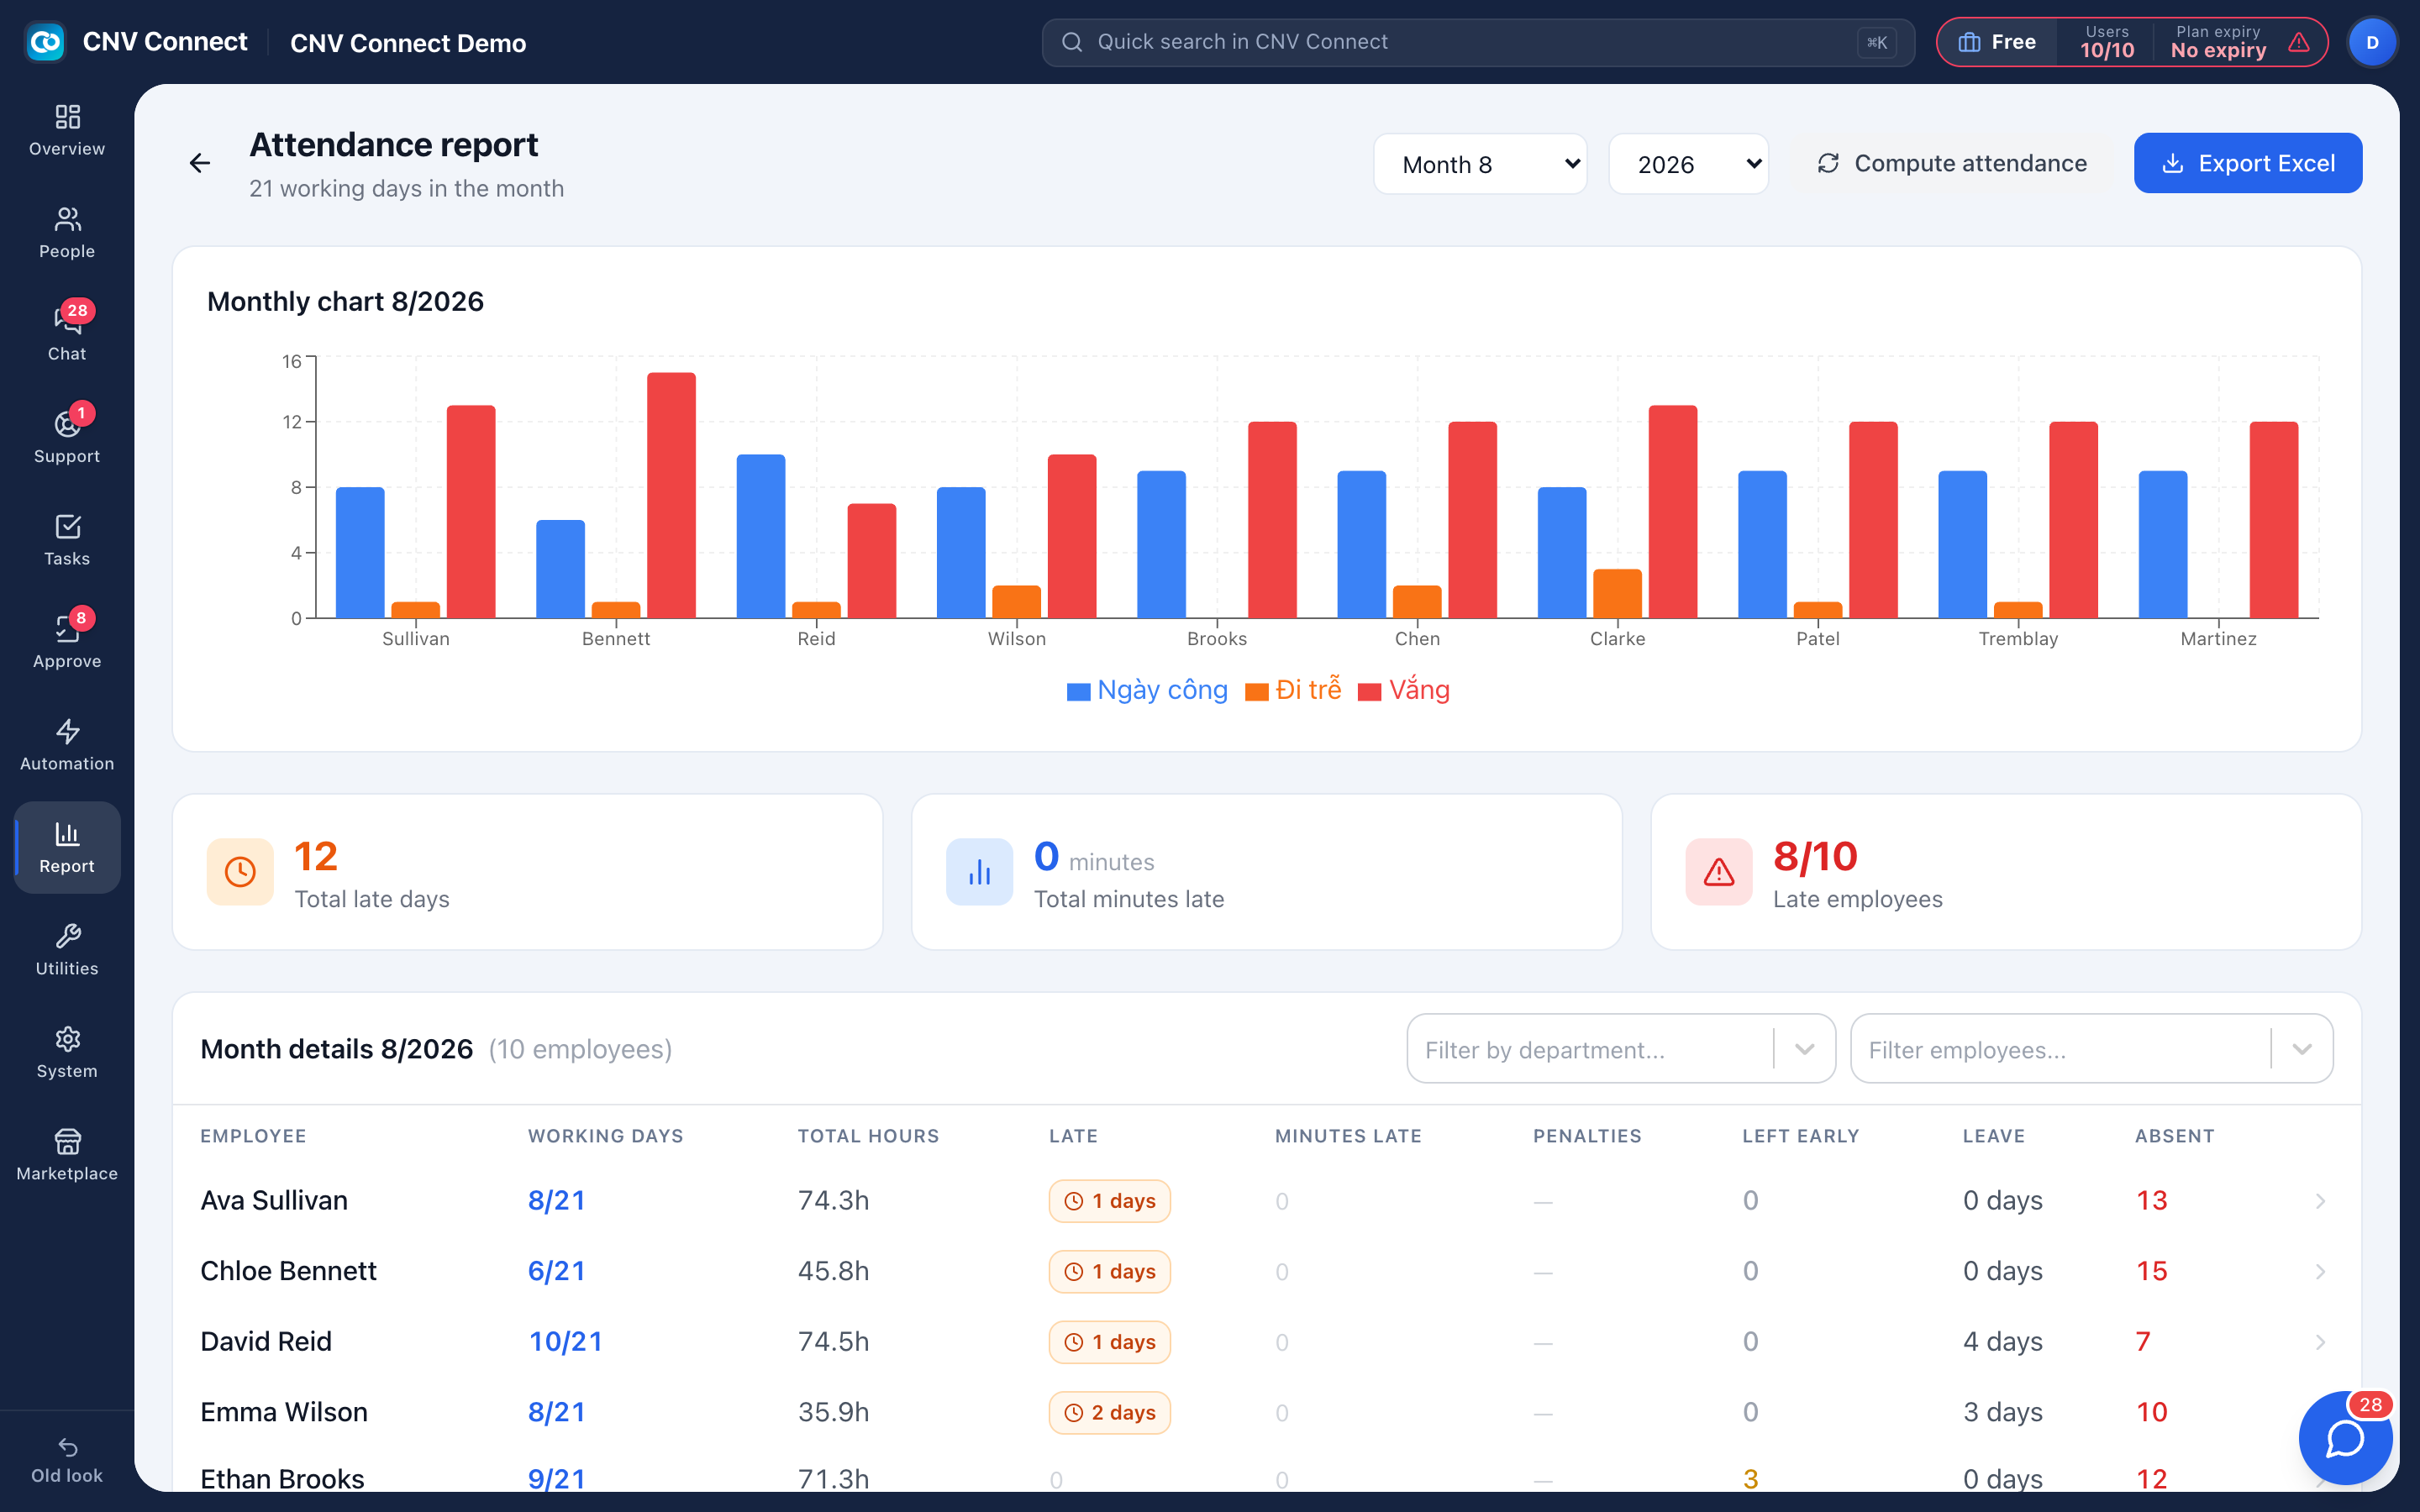
Month close
Compute the month, clear the unexplained absences, export to Excel for payroll.
Structure
Headcount per department, tenure, permanent versus probation, and contract stages.
Assets
Stock position by status and condition, plus handover and reclaim statistics per period.
Live, not overnight
Reports read the same rows as the lists — fix a record and the report changes. The attendance summary is the one exception: it is computed on demand, so after changing a shift, a rule or a correction you re-run it and the month is restated.
- Filter by department or employee before exporting
- Late days, minutes late, penalties, early leaving, leave and absence side by side
- Approval statistics show volume per template and speed per approver
- Support dashboards break the ticket queue down by any dimension
How teams set this up
- Open the report hub and search by the word you would use for the question.
- Set the period and the filters.
- Export to Excel where you need to hand the numbers on.
Frequently asked
Why do two people see a different number of reports?
The catalogue is filtered by permission, so each role sees the reports it is allowed to open.
Can we build custom reports?
The catalogue covers the operational questions; for anything bespoke, the API lets you pull the underlying records.
Works with
Time clock & attendance
People clock in from their phone inside a location you registered.
People & HR
Records, contracts and renewals, departments, the org chart, leave requests and yearly balances — the master list that attendance, assets and approvals all read from.
Assets & equipment
Laptops, tools, vehicles and phones with a movement log — plus the online accounts and subscriptions you pay for every month.
Get your whole team on one system this week
The Free plan covers 10 users with every module switched on — no card, no sales call, no migration project.
Free forever for 10 users · no credit card · set up in an afternoon